|
The usage of a daily quote computed from a formula, instead of real
quote has the main advantage of having a full set of controllable
characteristics like the noise/trend ratio or the length of the time
series and the not small advantage to be copyright free.
The formula for the computation of an artificial daily quote
(open,max,min,close prices) is written having in mind a
model for a real quote composed by two addends: a trend and a noise.
The adopted model does not pretend to be an accurate simulation of
real data, it is mainly addressed to the debugging and demonstration of
the trading system.
The Artificial Quote trend is computed as sum of 3 contributes:
a fixed bias, a linear trend, a sinusoidal oscillation. Around this trend,
the max-min range is computed as the product of a normal noise with a given
percentual of trend. The cross point between max-min range and trend is
computed as a uniform noise value with max-min range spanning. The same is
done for open and close prices. Amplitudes and periods of all these
components are given by a set of parameters.

Artificial Quote Parameters
| bias
| 10
|
| linear trend slope
| 1
|
| linear trend period
| 250 days
|
| sinusoidal trend amplitude
| 1
|
| sinusoidal trend period
| 250 days
|
| noise standard deviation
| 0.01
|
| quote length
| 500 days
|
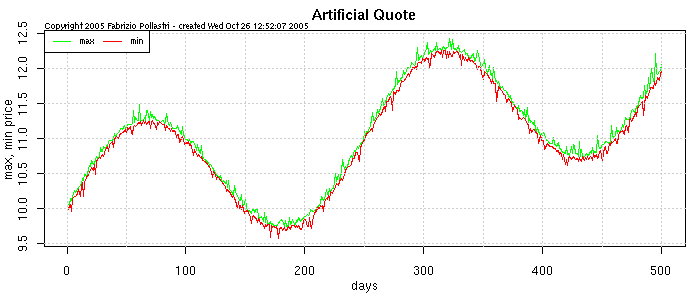
The plotting shows the maximum and minimum daily prices of the artificial
quote used to build the turtle trading demo. This artificial quote is
computed introducing in the formula the set of parameters shown in the
table.
You can refer the amplitude units (i.e. bias=10) to any currency
you like. The fixed bias is set to 10 units. The linear trend
slope is set to 1 units per 250 quotation days, approximately
corresponding to the number of the open days of financial markets in
one solar year. This lead to a reasonable positive linear trend of 10%
per year. The same concept is applied to the sinusoidal trend:
amplitude 1 units, period 250 quotation days. The sum of the two trends
give for every year and reference to year start, a maximum of about
+12.5% at the end of the first quarter, a middle value of about +5% at
half year, a minimum of about -2.5% at the end of the third quarter,
a final value of about +10% at year end. The percentual of trends sum
used to compute the daily price range (max - min prices) is set a normal
noise with a standard deviation of 0.01 units. This means a daily quote
price volatility of 0.01%, corresponding to the dynamics of a normal market
share. Finally, the length of the quote time series is set to 500 days
corresponding to 2 solar year of financial market trading days. Since,
the "Original Turtle Trading System" is substantially a trend follower
that use breakin and breakout signals with periods of thens of days,
it is important to have a quote length of at least 2 years to let the
System to execute a minimum number of trading operations to evaluate
its performance.
|
